Dollar traders huddle up!
The U.S. dollar index (DXY) is dropping faster than Taylor Swift dropped an extra 15 songs following her latest album release.
Will the downswing send the Greenback to a key technical support zone?
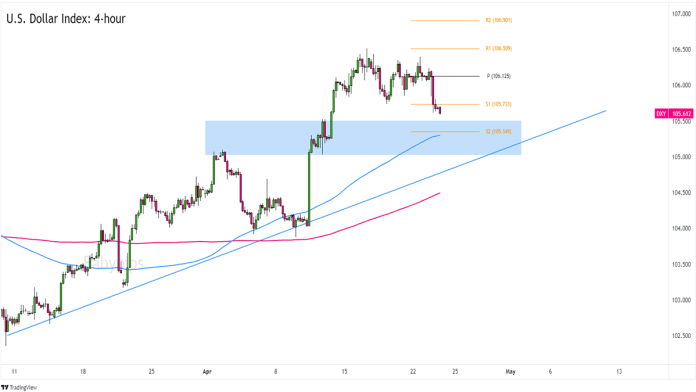
U.S. Dollar Index (DXY) 4-hour Forex Chart by TV
In case you missed our latest Daily Broad Market Recap, you should know that the U.S. dollar gave up pips after Uncle Sam printed weaker-than-expected manufacturing and services PMIs in April.
See, weaker economic prospects brought back interest rate cut bets for the Fed and highlighted the relatively stronger PMIs seen in other major economies.
Remember that directional biases and volatility conditions in market price are typically driven by fundamentals. If you haven’t yet done your fundie homework on the U.S. dollar, then it’s time to check out the economic calendar and stay updated on daily fundamental news!
The dollar index fell from its consolidation just above the 106.00 psychological area and is now trading close to the 105.60 level just under the S1 (105.73) Pivot Point support zone.
Are we looking at the start of a long-term bearish turn? Or is this just a pullback from a weeks-long uptrend?
The S2 (105.35) level is an area to watch as it lines up with a support and resistance zone from earlier this month. More importantly, it’s near the 100 SMA and is not too far from a trend line support that’s been around since late March.
A bounce from S2 opens the dollar to a bounce back to its consolidation above the 106.00 mark. Then, depending on overall dollar demand, we could see a move to higher potential inflection points like R1 (106.51) or R2 (106.90) Pivot Point lines.
But if DXY extends its downswing, or if it consistently trades below the trend line we’ve marked, then we may see a longer-term bearish run for the currency index.
In case of a breakout below the trend line, look out for potential moves to previous areas of interest like 104.50 or 104.00.
Good luck and good trading this one!
The post Chart Art: U.S. Dollar Index’s (DXY) Trend Support Zone first appeared on Investorempires.com.


